Sunday 4 July 2021

WireGuard setup Openwrt with VXLAN


Using the latest openWRT/LEDE image (openwrt-21.02.0-rc3-x86-generic-generic-ext4-combined) for WireGuard on GNS3. By default we must to change Openwrt network IP(192.168.100.1 and 192.168.100.2), GW (192.168.100.254) and add DNS (8.8.8.8):


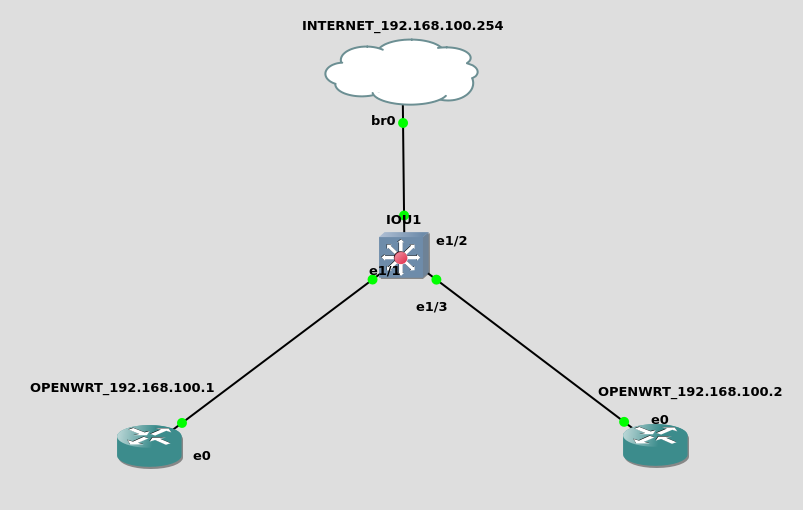
Also change DNS settings to 8.8.8.8 :


For this using the following network setup:


For WireGuard we must install following packages (the same thing can be done in GUI "System" --> "Software" section).

opkg install luci-proto-wireguard wireguard-tools luci-app-wireguard kmod-wireguard

Initial setup of Wireguard is privarte and publick key generation on both nodes and setup via luci interface

mkdir /VPN
cd /VPN
#Generating public key
wg genkey > pub.key
#Generating private key
wg pubkey < pub.key  > pri.key

After generating private and public keys we must setup WireGuard via luci (WebGUI) inteface by creating new network interface  "Add new Interface..." in Network --> Interface.

The configuration on Node 192.168.100.2

First we must create WireGuard interface, the name of interface is wg0:
After it we setup new interface be defining, "Private Key", which was generated in last step, also good idea to setup Listen Port (exp 51820) and the IP of the Wiregaud interface (10.0.0.2/24) on the node OPENWRT_192.168.100.2, on OPENWRT_192.168.100.1 we will use 10.0.0.1/24

After it we must setup remote node in "Peers" add "Add peer": 

And setting for remote node the following fields:

Description : 192.168.100.2
Public Key: ENleaCdfs   - the file pub.key in other node (OPENWRT_192.168.100.1)
Allowed IPs: 10.0.0.0/24
Endpoint Host: 192.168.100.2
Endpoint Port: 51820
Persistent Keep Alive: 10 - optional settings, this will help work from behind the NAT and also tunnel will be up fro all time.

Also for testing you should put the new Wireguard interface  to lan zone, after create separate security zone


The same configuration must be applied to other node. To activate the change or after modification you need to restart network service in menu "System" --> "Startup".
To check status status of WireGuard from CLI is just ping the remote node to use the wg comand to see the status of tunnel. The bad thing that you will not see any active socket open in netstat -nap command.


The same info can be seen from GUI in "Status" --> "WireGuard" menu section.


If tunnel is down (transfer is none) or the remote node does not respond to ping or  always good to check the wireshark on GNS3 or tcpdump on node also to see in wg if the remote public key matches local peer key. Also to see if the network node you are pinging is in routing table. The bad thing that you will not see any active socket open in netstat -nap command.

VXLAN configuration

To set up the L2 connectivity from one node to other we will use vxlan, it's an encapsulation technique to encapsulate OSI layer 2 Ethernet frames in layer 4 UDP datagrams (RFC4789). 
For it we will need to install following packages:

opkg install vxlan kmod-vxlan luci-proto-vxlan
 
After installing the needed packages we will have to create net network interface "Add new interface..." in "Network" --> "Interfaces". As we are running IPv4 network we use the VXLAN (RFC7348) interface type.


Also for first/testing we setup the VXLAN interface binding on LAN interface, in this case the traffic will not be encrypted, the configuration should be as follows: 


Like in WireGuard configuration VX0 interface should be  added to Firewall-zone: lan, to allow full access for testing.


To test IP connectivity we will create new BRIDGE interface with IP. The new Bridge will connect VX0 interfaces  to LAN intefaces eth1.


In OpenWRT new bvridge interface is create in Network --> Interfaces --> Device  "Add device configuration"


And after it create IP interface in "Interfaces" section and assign IP address on 172.16.0.1 on left node and 172.16.0.2 on right node.

At this point the IP connectivity should be working after restarting network service or after reboot, the issue with vxlan as in WireGuard, the netstat does not show socket usage. So classically only Wireshark or TCP dump can show VXLAN traffic:

The configuration of the VXLAN interface vx0 in OpenWRT:

And ofcource the tcpdumo traffic sniff on vx0 intergface to see if our traffic can pass the new WireGuard and VXLAN tunnels:


In this configuration we can pass traffic from one end to other via L2 link and even have trunk connection between to switcher connected at the end of routers:


To see if traffic pass correctly we should see from sniff made on link on node "Switch1" and OPENWRT_192.168.100.1, we should see VLAN tag and traffic passing from PC1 to PC2.


The main  disadvantage (nasty thing) is that the MTU/frame size must be bellow MTU of the vx0 interface (in our case less then 1370 Bytes), also including the Ethernet and vlan headers. So setting the network we must set the PC1 and PC2 MTU size much smaller, also keeping in mind that we could be using QinQ or other encapsulation methods.

A topic for L2 fragmentation i think:)


Saturday 27 March 2021

Python Elasticsearch


Basic ElasticSearch connection to from Python and search, the main issue is to convert the retrieved data to your suitable  needs.  For begging limit the data we receive by using size option in (size=10), and limit the retrieving fields, only the needed one ("_source": ["field_x", ..., "field_y"],).
the biggest issue is the the nested dict we receive from  ElasticSearch, to convert to DataFrame we musrt to use the json_normalize.


 1
 2
 3
 4
 5
 6
 7
 8
 9
10
11
12
13
14
15
16
17
18
19
20
21
22
23
24
25
26
27
28
29
30
31
32
33
34
35
36
37
38
39
40
41
42
43
44
45
46
47
48
49
50
51
52
53
54
55
56
57
58
# Elasticsearch stuff to import

import ssl, certifi
from elasticsearch import Elasticsearch
from elasticsearch.connection import create_ssl_context
from elasticsearch import Elasticsearch, RequestsHttpConnection

# Panda stuff to import
from pandas import json_normalize

def main_search1():
    # # no certificate verification
    ssl_context = create_ssl_context()
    ssl_context.check_hostname = False
    ssl_context.verify_mode = ssl.CERT_NONE

    es = Elasticsearch(hosts=[{'host': '127.0.0.1', 'port': 9200}],
                       scheme="https",
                       # to ensure that it does not use the default value `True`
		               connection_class=RequestsHttpConnection,
                       # enable SSL
                       use_ssl=True,
                        verify_certs=False,
                       http_auth=("user", "password"))
    print (es.info())
    # search query on elasticsearch
    result = es.search(
    index="syslog-2021.03.12",
    body={
        # field to retriev from elasticsearch
        "_source": ["cisco", "timestamp"],
        # search query
        "query": {
		"match": {
  			'user.name':'test'
		}
        }
    },
    # number of results to retriev
    size=10)

    # show retriewed result "['hits']['hits']"  show only found data
    print(result['hits']['hits'])

    # print results from Elasticsearch
    all_hits = result['hits']['hits']
    for num, doc in enumerate(all_hits):
        print ("DOC ID:", doc["_id"], "--->", doc, type(doc), "\n")


    #convert to Panda DataFrame with normalize dictiniory --> https://pandas.pydata.org/pandas-docs/stable/reference/api/pandas.json_normalize.html
    res_content_pd = json_normalize(result['hits']['hits'])
    print (res_content_pd)
    return


if __name__ == '__main__':
    main_search1()

Elasticsearch-dsl

The main problem of using Elasticsearch API is the query (body) syntax, it's not human friendly especial for first time or mass usage in code, it's hard to write debug and execute correctly.
The main idea of Elasticsearch-dsl is to simplify the query and filters of API.
 
 1
 2
 3
 4
 5
 6
 7
 8
 9
10
11
12
13
14
15
16
17
18
19
20
21
22
23
24
25
26
27
28
29
30
31
32
33
34
35
36
37
38
39
40
41
42
43
44
45
46
47
48
49
50
51
52
53
54
55
56
57
58
59
60
61
62
63
64
65
66
67
# Elasticsearch stuff to import

import ssl, certifi
from elasticsearch import Elasticsearch
from elasticsearch.connection import create_ssl_context
from elasticsearch import Elasticsearch, RequestsHttpConnection

# Panda stuff to import
from pandas import json_normalize
from elasticsearch_dsl import Search, Q
def main_search2():
    # # no certificate verification
    ssl_context = create_ssl_context()
    ssl_context.check_hostname = False
    ssl_context.verify_mode = ssl.CERT_NONE

    es = Elasticsearch(hosts=[{'host': '127.0.0.1', 'port': 9200}],
                       scheme="https",
                       # to ensure that it does not use the default value `True`
                       connection_class=RequestsHttpConnection,
                       # enable SSL
                       use_ssl=True,
                       verify_certs=False,
                       http_auth=("user", "password"))
    print (es.info())

    # search query on elasticsearch-dsl, more simple way ti make logical queries
    # if searchig for nested data (example user:{name:'test1'} we must use double ** if not nested no ** needed
    query = Q('match', **{'user.name':'test'}) & Q('match', **{'observer.ip':'1.1.1.1'})

    #difine index ant result numbet to retriev with size option
    s = Search(using=es, index='syslog-2021.03.12').query(query).extra(size=4000)

    # define fields to retriev fields(['timestamp', 'cisco'])
    s = s.source(['timestamp', 'cisco'])

    #count the number of resuls
    total = s.count()
    print(total)
    #difine tthe numbet of results to retriev
    s = s[0:10]
    # Execute function search and return an instance of Response wrapping all the data.
    # if retrieving big data set use scan() option which returns a generator that will iterate over all the documents matching the query.
    res_content = s.execute()


    # show retriewed result "['hits']['hits']"  show only found data
    print(res_content['hits']['hits'])

    # print results from Elasticsearch
    all_hits = res_content['hits']['hits']
    for num, doc in enumerate(all_hits):
        print ("DOC ID:", doc["_id"], "--->", doc, type(doc), "\n")

    # convert to Panda DataFrame with normalize dictiniory --> https://pandas.pydata.org/pandas-docs/stable/reference/api/pandas.json_normalize.html
    results= [d.to_dict() for d in res_content]
    res_content_pd1 = json_normalize(results)
    print(res_content_pd1)

    # not os effiecient way of using ['hits']['hits'], not make dataframe (more time is needed )
    res_filtered = [x['_source'].to_dict() for x in res_content['hits']['hits']]
    res_content_pd2 = json_normalize(res_filtered)
    print (res_content_pd2)


if __name__ == '__main__':
    main_search2()


The main difference of the Elasticsearch and Elasticsearch-dsl is the query fields:

query = Q('match', **{'user.name':'test'}) & Q('match', **{'observer.ip':'1.1.1.1'})

We can define the match query and logical values or and, etc..
To match field within another field we must use ** for defining nested dict sub values by dot.
Section "Dotted fields"


Sunday 29 December 2019

Raspberry PI4 Olimex MOD-LCD3310 Python SPI

How to connect MOD-LCD3310 to Raspberry pi4  via SPI interface

  1. Rasberry pi4 with rasbian -->
  2. One Olimex MOD-LCD3310 LCD -->
  3. Ribbon cables female/female (need 8)
First download and install Python and is modules from github.com https://github.com/Bingzo/replicape/tree/master/libs/spi

#sudo sudo python setup.py build

and install (if you do not wish to use this module you and only build and use it from the build directory with out install)

sudo sudo python setup.py  install

Pinout

The olimex MOD-LCD3310 UEXT pinout is shown bellow. 

Rasberri Pi pinout and it's numbering can be found here https://pinout.xyz/ 
For my setup i used Raspberri Pi4 pins as follows


 -----------------------------------------
| Raspberri PI |              |           |
| Physical pin |  MOD-LCD331  |    Name   |
|--------------|--------------|-----------| 
|      1       |      1       |    3.3V   |
|     19       |      8       |    MOSI   |
|     21       |      7       |    MISO   |
|     23       |      9       |  SCLK/SCK |
|     24       |     10       |  CE0/SSEL |
|     39       |      2       |    GNT    |
|     27       |      6       |  GPIO0/SDA|
|     28       |      5       |  GPIO1/SCL|
 -----------------------------------------
Something like this :)


Download the 3310.py code from github https://github.com/OLIMEX/raspberrypi/tree/master/MOD-LCD-3310

Install missing python modules to Raspberri and enable spi via raspi-config --> Interfacing Options --> SPI

pip install termcolor RPi.GPIO

Execute code using old spi module


import RPi.GPIO as GPIO
import time
GPIO.setmode(GPIO.BCM)
GPIO.setwarnings(False)
GPIO.setup(0, GPIO.OUT)     #SDA -> LCD_C/#D
GPIO.setup(1, GPIO.OUT)     #SCL -> #LCD_RESET
GPIO.output(0, True)
GPIO.output(1, True)
from spi import SPI
lcd = SPI(0, 0)
lcd.msh = 1000000

#define some variables
SEND_CMD = 0
SEND_CHR = 1

LCD_X_RES = 84
LCD_Y_RES = 48

PIXEL_OFF = 0
PIXEL_ON = 1
PIXEL_XOR = 2

FONT_1X = 1
FONT_2X = 2

LCD_CACHE_SIZE = ((LCD_X_RES * LCD_Y_RES) / 8)


LcdMemIdx = 0
LcdMemory = [0x00] * LCD_CACHE_SIZE
LCD_START_LINE_ADDR = 64

SEND_CMD = 0
SEND_CHR = 1

def LCD_DC_HIGH():
    GPIO.output(0, True)
    return

def LCD_DC_LOW():
    GPIO.output(0, False)
    return

def LCDClear():
    #"Clear LCD"
    for i in range(LCD_CACHE_SIZE):
        LcdMemory[i] = 0x00
    return

def LCDReset():
    GPIO.output(1, False)
    time.sleep(0.05)
    GPIO.output(1, True)

def LCDUpdate():
    #"Update LCD memory"
    
    for y in range(6):
        LCDSend(0x80, SEND_CMD)
        LCDSend(0x40 | y, SEND_CMD)
        for x in range(84):
            LCDSend(LcdMemory[(y * 84) +x], SEND_CHR)
    return

def LCDSend(data, cd):
    #print
    if cd == SEND_CHR:
        LCD_DC_HIGH()
    else:
        LCD_DC_LOW()
        
    lcd.writebytes([data])    
    return
    
    
def LCDInit():
    #"Init LCD Controller"
    LCDReset()
    
    LCDSend(0x03, SEND_CMD)
    time.sleep(1)
    LCDSend( 0x21, SEND_CMD)                                        #LCD Extended Commands
    LCDSend( 0xC8, SEND_CMD)                                        #Set KCD Vop (contrast)
    LCDSend( 0x04 | int(not(not(LCD_START_LINE_ADDR & (1 << 6)))), SEND_CMD)   #Set Temp S6 for start line
    LCDSend( 0x40 | (LCD_START_LINE_ADDR & ((1<<6 0x08="" 0x0c="" 0x12="" 0x20="" 1:68="" addressing="" bias="" blank="" commands="" contrast="" def="" et="" extended="" for="" horizontal="" in="" lcd="" lcdclear="" lcdcontrast="" lcdsend="" lcdupdate="" line="" mode="" normal="" ontrast="" pre="" s="" send_cmd="" standard="" start="" temp="" vop="" x20="" x21="" x80="" xff="">


Code with SPIDEV:


import RPi.GPIO as GPIO
import time
import spidev
GPIO.setmode(GPIO.BCM)
GPIO.setwarnings(False)
GPIO.setup(0, GPIO.OUT)     #SDA -> LCD_C/#D
GPIO.setup(1, GPIO.OUT)     #SCL -> #LCD_RESET
GPIO.output(0, True)
GPIO.output(1, True)

lcd = spidev.SpiDev()

lcd.open(0,0)
lcd.max_speed_hz = 1000000


#define some variables
SEND_CMD = 0
SEND_CHR = 1

LCD_X_RES = 84
LCD_Y_RES = 48

PIXEL_OFF = 0
PIXEL_ON = 1
PIXEL_XOR = 2

FONT_1X = 1
FONT_2X = 2

LCD_CACHE_SIZE = ((LCD_X_RES * LCD_Y_RES) / 8)


LcdMemIdx = 0
LcdMemory = [0x00] * LCD_CACHE_SIZE
LCD_START_LINE_ADDR = 64

SEND_CMD = 0
SEND_CHR = 1

def LCD_DC_HIGH():
    GPIO.output(0, True)
    return

def LCD_DC_LOW():
    GPIO.output(0, False)
    return

def LCDClear():
    #"Clear LCD"
    for i in range(LCD_CACHE_SIZE):
        LcdMemory[i] = 0x00
    return

def LCDReset():
    GPIO.output(1, False)
    time.sleep(0.05)
    GPIO.output(1, True)

def LCDUpdate():
    #"Update LCD memory"
    
    for y in range(6):
        LCDSend(0x80, SEND_CMD)
        LCDSend(0x40 | y, SEND_CMD)
        for x in range(84):
            LCDSend(LcdMemory[(y * 84) +x], SEND_CHR)
    return

def LCDSend(data, cd):
    #print
    if cd == SEND_CHR:
        LCD_DC_HIGH()
    else:
        LCD_DC_LOW()
        
    lcd.writebytes([data])    
    return
    
    
def LCDInit():
    #"Init LCD Controller"
    LCDReset()
    
    LCDSend(0x03, SEND_CMD)
    time.sleep(1)
    LCDSend( 0x21, SEND_CMD)                                        #LCD Extended Commands
    LCDSend( 0xC8, SEND_CMD)                                        #Set KCD Vop (contrast)
    LCDSend( 0x04 | int(not(not(LCD_START_LINE_ADDR & (1 << 6)))), SEND_CMD)   #Set Temp S6 for start line
    LCDSend( 0x40 | (LCD_START_LINE_ADDR & ((1<<6 0x08="" 0x0c="" 0x12="" 0x20="" 1:68="" __name__="=" addressing="" bias="" blank="" commands="" contrast="" def="" et="" extended="" for="" horizontal="" if="" in="" lcd="" lcdclear="" lcdcontrast="" lcdsend="" lcdupdate="" line="" main__="" mode="" normal="" ontrast="" pre="" s="" send_cmd="" standard="" start="" temp="" vop="" x20="" x21="" x80="" xff="">


Wednesday 11 May 2016

FortiGate CLI HACKING


It's a short information on FortiGate CLI and get to linux shell (sort of that).

Basicly as we know most of networking vendors use Linux OS as main OS for there network devices,but for security reasons (they don't like to support old stuff) they hide the iner Linux shell from normal users (i don't like it:). In some device it is done good and nice and in some no so nice, some leave it only for debuging purpuse (Like in Forti). In this class we have old good Fortigare device, telling the truth i like this devices looking from the price point.

Ok back to main toppic, how to get to Linux from Fotigate CLI. We have two possible solliutions:

1. The first and more easy solliution is to use magic command fnsysctl + <linux CMD>

Forti # fnsysctl ls
bin               data              data2             dev              
etc               fortidev-x86_64   fortidev4-x86_64  ipc_quar         
ipc_quar_backup   lib               lib64             migadmin         
proc              sbin              smo               tmp              
usr               var      


It's easy, the most intersting thing is that we can get to higher privilgate level with this commad. For example if I am an read only user <test> dedicated for one vdom ( a virtual system, some kind of if)  and with only read privilage :

# the profile for test - Read Only
config system accprofile
    edit "test"
        set admingrp read
        set authgrp read
        set comments "read"
        set endpoint-control-grp read
        set fwgrp read
        set loggrp read
        set mntgrp read
        set netgrp read
        set routegrp read
        set sysgrp read
        set updategrp read
        set utmgrp read
        set vpngrp read
        set wanoptgrp read
        set wifi read
    next
end


# the user dedicated to only test vdom
config system admin
    edit "test"
        set accprofile "test"
        set vdom "test"
        set password ENC ***********

    next
end


So we can login in with our test user and see what can we do:

Forti login: test
Password: ****
Welcome !

Forti $ fnsysctl ls
bin               data              data2             dev              
etc               fortidev-x86_64   fortidev4-x86_64  ipc_quar         
ipc_quar_backup   lib               lib64             migadmin         
proc              sbin              smo               tmp              
usr               var        

Not so speacial, but we also can list and read full config of FortiGate and see outher VDOM settings :

# the location of configs in Fortigate Flash:
Forti $ fnsysctl ls  /data2/config
cfg0000000036  cfg0000000037  cfg0000000038  cfg0000000039  cfg0000000040 
cfg0000000041  cfg0000000042  cfg0000000043  cfg0000000044  cfg0000000045 
cfg0000000046  cfg0000000047  cfg0000000048  cfg0000000049  cfg0000000050


And afcouse we can read the woth cat:

Forti $ fnsysctl cat  /data2/config/cfg0000000075                                                                                                           
#config-version=FG100D-5.00-FW-build271-140409:opmode=0:vdom=1:user=admin
#conf_file_ver=23568740905703635265
#buildno=4429
#global_vdom=1

config vdom
edit root
next
edit ZONE1
next
edit test
next
edit opaopa
next
edit ZONE2
next
edit BRIDGE2

.....


With out the basic commands we have also ping,cat, kill,killall,ifconfig, etc, not all commands work but it's enouth for basic debuging.

The interesting thing is that the WEB GUI interface is running on django framework (python based):


fnsysctl ls /usr/lib/proj/                                                                                                                          
__init__.py   __init__.pyc  config.py     config.pyc    firewall     
fortiswitch   ftnt          logs          manage.py     pubredir     
registration  reports       router        settings.py   settings.pyc 
sprite        system        urls.py       user          utils        
utm           vpn           wanopt        wifi       

Saturday 18 July 2015

TCP ACK generation rate


A simple but also very impotent question of TCP, how often the TCP ACK should be generated?

According the RFC, the ACK SHOULD be generated for at least every second full-sized segment (to be correct this comes from RFC5681 which obsoletes RFC1122, because in old version come with confusion, saying in one place MUST in other SHOULD). Sound simple, but if look to Wireshark (after making iperf test) we would see that the ACK generation rate is much lower than TCP DATA (segment) rate.


First  of all i have to note that this is not a problems of system or TCP implementations because according the RFC it's allow to send TCP ACK less often (the ACK SHOULD be generated...). And in kernel code (i am only speaking about Linux Kernel) it is defined to send one ACK after two full size TCP data segments. 
Not going deep in exploitation t the TCP ACK rate difference is caused be two conditions :


1. TCP offloading to the NIC  - almost all modern NIC allow to offload some basic functions to NIC card (like TCP segmentation, IP CRC check and etc).
2. Due to high TCP receiving rate  - in same cases if the receiving rate is overfill the TCP receiver buffer it reduce the TCP ACK generation rate.

TCP offloading to the NIC 

TCP offloading to the NIC is mainly used to reduce the CPU load, because many minor check and calculations are made on NIC interface. It not only reduce system load but also allows faster transmission (It has also a dark side in it :). To control NIC offloading we use ethtool  command in linux.

To see current setting we use:

ethtool -k eth1
Features for eth1:
rx-checksumming: on
tx-checksumming: on
    tx-checksum-ipv4: off [fixed]
    tx-checksum-ip-generic: on
    tx-checksum-ipv6: off [fixed]
    tx-checksum-fcoe-crc: off [fixed]
    tx-checksum-sctp: off [fixed]
scatter-gather: on
    tx-scatter-gather: on
    tx-scatter-gather-fraglist: off [fixed]
tcp-segmentation-offload: on
    tx-tcp-segmentation: on
    tx-tcp-ecn-segmentation: off [fixed]
    tx-tcp6-segmentation: on
udp-fragmentation-offload: off [fixed]
generic-segmentation-offload: on
generic-receive-offload: on
large-receive-offload: off [fixed]
......

......

In our case we would like to turn off the following ofloading feaures:
tcp-segmentation-offload - tso
generic-segmentation-offload - gso
generic-receive-offload - gro
 
To change current NIC offloding setting we use:

ethtool -K eth1 gro off tso off  gso off 

(we should make on both system - sender and receiver)

We also turned off both the receiving offloading because with some NIC's  will see not aggregated TCP packets.
The results of the TCP ACK and TCP Data with segmentation offloading turned can be seen in picture beloow:


Now it's more like to say that TCP ACK generation rate is more likely according to RFC. 
But be turning off the TCP ACK offloading we will increase to system CPU and  reduce the data performance of the system.

In testing purpose it is good to turn off the pause frame support (not allowing the receiver or network node to reduce sending rate due to heavy system load of the receiver)

ethtool  -A eth0 trx off tx off autoneg off

To check the status if the pause frame was turned off:

ethtool  -a eth0

TCP acknowledgment in Linux Kernel

To understand the TCP ACK generation in Linux kernel first we have to look to source code of TCP stack. The function responsible for ACK generation is call  __tcp_ack_snd_check, it check if ACK should be send now ( tcp_send_ack) or should be delayed (  tcp_send_delayed_ack ). To full code of function is showed bellow:


4817 static void __tcp_ack_snd_check(struct sock *sk, int ofo_possible)
4818 {
4819         struct tcp_sock *tp = tcp_sk(sk);
4820
4821             /* More than one full frame received... */
4822         if (((tp->rcv_nxt - tp->rcv_wup) > inet_csk(sk)->icsk_ack.rcv_mss &&
4823              /* ... and right edge of window advances far enough.
4824              * (tcp_recvmsg() will send ACK otherwise). Or...
4825              */
4826              __tcp_select_window(sk) >= tp->rcv_wnd) ||
4827             /* We ACK each frame or... */
4828             tcp_in_quickack_mode(sk) ||
4829             /* We have out of order data. */
4830             (ofo_possible && skb_peek(&tp->out_of_order_queue))) {
4831                 /* Then ack it now */
4832                 tcp_send_ack(sk);
4833         } else {
4834                 /* Else, send delayed ack. */
4835                 tcp_send_delayed_ack(sk);
4836         }
4837 }


The tcp_ack_snd_check function checks if TCP acknowledgment must be send now , execute   tcp_send_ack() function or can  be delayed tcp_send_delayed_ack(). To allow the kernel to send the TCP ACK packet now 4 conditions must be meet:


  1. The first condition that the received data segment or unacknowledged data must by more than one  maximum segment size for defined in session icsk_ack.rcv_mss variable. This comes from RFC1122 or STD003 specification (4.2.3.2 section), saying that an ACK SHOULD be generated for at least every second full-sized segment (to be correct this comes from RFC5681 which obsoletes RFC1122, because in old version come with confusion, saying in one place MUST in other SHOULD).
    (tp->rcv_nxt - tp->rcv_wup) > inet_csk(sk)->icsk_ack.rcv_mss &&__tcp_select_window(sk) >= tp->rcv_wnd)

    This logical condition has two parts, the first part we seen that the unacknowledged data must be more then
    inet_csk(sk)->icsk_ack.rcv_mss value, theoretically it is not according the RFC, but in practice this condition is met after receiving the second TCP segment. That is very important here is that the RFC define that the ACK “SHOULD”, but not “MUST” be generated. So basically RFC allows us to generate the ACK more rarely.
  2. In the second conditions says that the TCP receive window or usable buffer space must be bigger the the receive windows or advertised TCP window by the server to the client. This is done to overcome the the Silly windows syndrome (SWS) problem, which was first defined in RFC813. It occurs due the bad system implementation of TCP flow control or due to the slow system, which consumes data slowly or can’t handle the received information. In such conditions the receive windows rcv_wnd is filled with data much faster  than it can handle it (clean up the receive buffer). In such condition the kernel must reduce the advertised window, by sending the update size to the client. This condition would go on until the receive window is set to minimal allowed size, making the data transmission ineffective. By forbidding the server to send  TCP ACK packet, we reduce the packet flow rate, the client must wait for ACK for sending more data and reduce the server load. This condition also satisfies the RFC5681 that “an ACK SHOULD be  generated for at least every second full-sized segment”.
  3. The third condition check if tcp_in_quickack_mode(sk) any data are ping-ponged back to the client, in such case the TCP connection in interactive state and an ACK packet must be send immediately (like telnet or remote data access information applications). In the other way the kernel would wait up to 500ms before sending an ACK message.
  4. The fourth and final conditions check if  the server receives out of order data, by checking the ofo_possible variable and the looking to receive queue tp->out_of_order_queue, to see if any out-of-order packet are received. This must be done for faster data recovery and improves TCP recovery time after a loss RFC5681 - “A TCP receiver SHOULD send an immediate duplicate ACK when an out-   of-order segment arrives.  The purpose of this ACK is to inform the   sender that a segment was received out-of-order and which sequence   number is expected.”This condition usually happens if packet loss or corruption occurs in the link between the client and server.

After checking these conditions (the first and second are in conjunction), kernel can send ACK message immediately if one of three conditions are true, else the the sending of ACK message must be delayed, by calling the tcp_send_delayed_ack function, which adjust the sending time based on RTT value and system MIN and MAX delay values. In case where is no packet drop or the TCP session has not ping-pong data going back to the sender, the TCP acknowledgment generation directly relay on first two conditions (if more than one full size segment is received and the we have enough space in receive buffer). 

Results/Outcome :

The TCP ACK generation rate mostly depends from two things, the NIC (TCP) offloading, which reduce TCP ACK rate (also reduce the system load) and the Linux Kernel TCP generation function tcp_ack_snd_check() function. According one condition of the function (__tcp_select_window(sk) >= tp->rcv_wnd) the ACK  must be delayed until the buffter get freed.